Facts About the U.S. Black Population
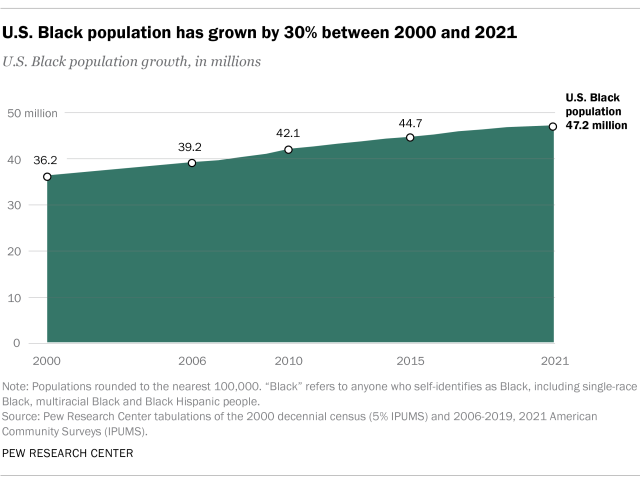
The Black population of the United States is growing. In 2021, there were an estimated 47.2 million people who self-identified as Black, making up 14.2% of the country’s population. This marks a 30% increase since 2000 when there were 36.3 million Black people living in the U.S.
Black Americans are diverse. This group consists of people with varied racial and ethnic identities and experiences. The nation’s Black population includes those who say their race is Black, either alone or in combination with other racial backgrounds. It also includes Hispanics or Latinos who say their race is Black.
This fact sheet is a profile of the demographic, geographic and economic characteristics of the U.S. Black population in 2021. To present detailed data about this group, charts and analysis about the Black population are analyzed through the lens of four different demographic groups:
- The total U.S. Black population
- Single-race, non-Hispanic Black people
- Multiracial, non-Hispanic Black people
- Black Hispanic people
Scroll down or click through the navigation below to read about various demographic and economic characteristics of the U.S. Black population.
Click here for a downloadable spreadsheet (.xlsx) of these findings.
Table of Contents
- Population Growth
- Age Structure
- Languages
- Geography
- Household Income
- Household Type
- Educational Attainment
- Religious Affiliation
Population Growth
1. All Black
An estimated 47.2 million people in the U.S. identified as Black in 2021. The Black population has grown by more than 10 million since 2000, when 36.2 million of the U.S. population identified as Black, marking a 30% increase over two decades.
In 2021, there were 4.8 million foreign-born Black Americans, about 10% of the U.S. Black population. This is an increase from 2000, when 2.4 million people, or 7%, among the Black population were foreign-born.
2. Single race, non-Hispanic
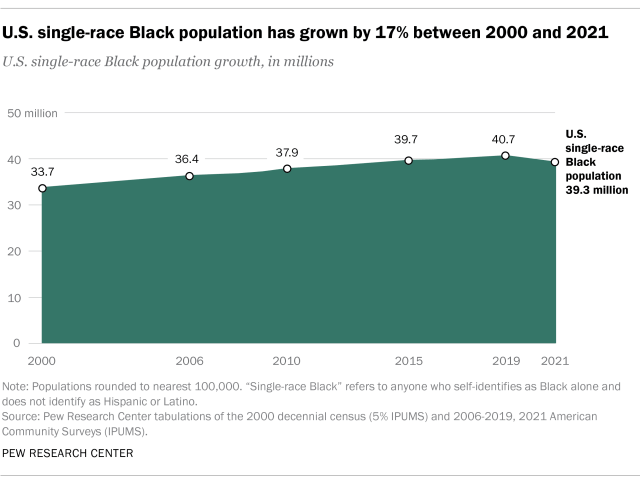
In 2021, the single-race, non-Hispanic Black population was the largest demographic subgroup of the U.S. Black population, numbering 39.3 million or 83% of the total. This marks an increase of 16% since 2000 when the population was 33.8 million.
About 3.9 million members of this population are immigrants from other countries, meaning 10% of single-race Black people are foreign-born in 2021. This is an increase over 2000, when 1.9 million people (roughly 6%) among the single-race, non-Hispanic Black population were foreign-born.
3. Multiracial, non-Hispanic
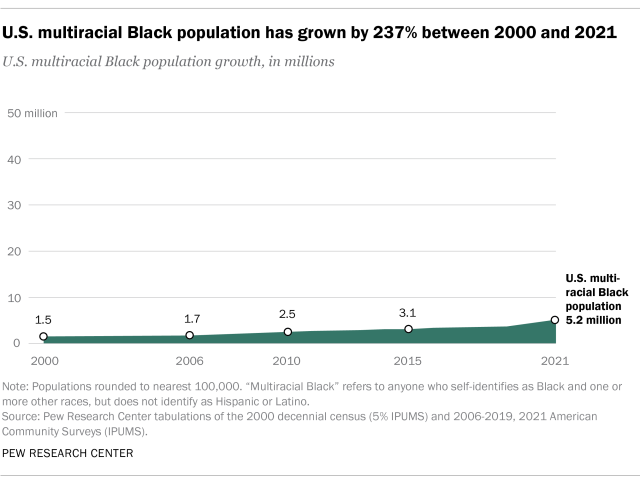
The multiracial non-Hispanic Black population is the second-largest subgroup among Black Americans, with 5.2 million people – accounting for 11% of the overall Black population in 2021. It has grown from 1.5 million in 2000, marking a 238% increase.
Additionally, 400,000 members of the multiracial Black population are foreign-born (8%), as of 2021. The number of foreign-born members of this group has increased from 250,000 people in 2000, but their share of the multiracial Black population has decreased from 16% in 2000.
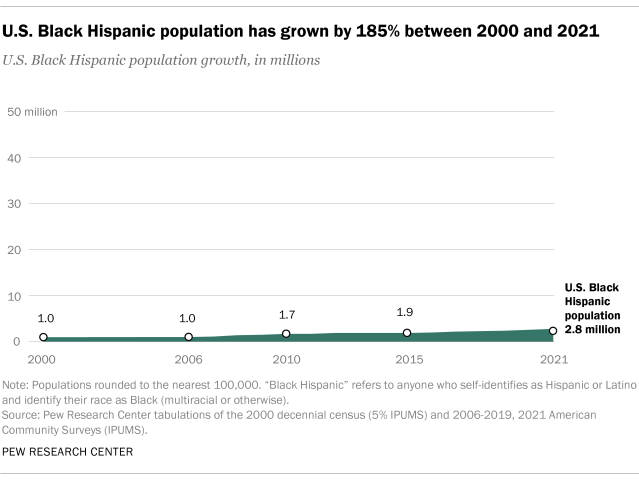
4. Black Hispanic
There were 2.8 million Black Hispanic people in the U.S. in 2021, which was 6% of the total Black population that year, making this subgroup the smallest population group included in this analysis. This population has grown from 960,000 in 2000 to 2.8 million in 2021, marking a 191% increase.
Additionally, 500,000 members of this population are immigrants to the U.S., meaning that almost one in five Black Hispanics (18%) are foreign-born. The number is an increase from 2000, when 260,000 Black Hispanic people were foreign born. However, this represents a decline in the share of the Black Hispanic population who are immigrants: That share has decreased from 27% in 2000 to 18% in 2021.
Notably, the Black Hispanic U.S. population is not necessarily the same population as the nation’s Afro-Latino population, as not all people who say they are Black and Hispanic identify as Afro-Latino and not all Afro-Latinos self-identify as Black, Hispanic or with both identities.
Age Structure
1. All Black
The U.S. Black population is young. The median age of Black people in 2021 was 33 years, five years younger than the U.S. population’s median age of 38. Roughly 30% of the entire Black population was below the age of 20 while 12% were 65 or older.
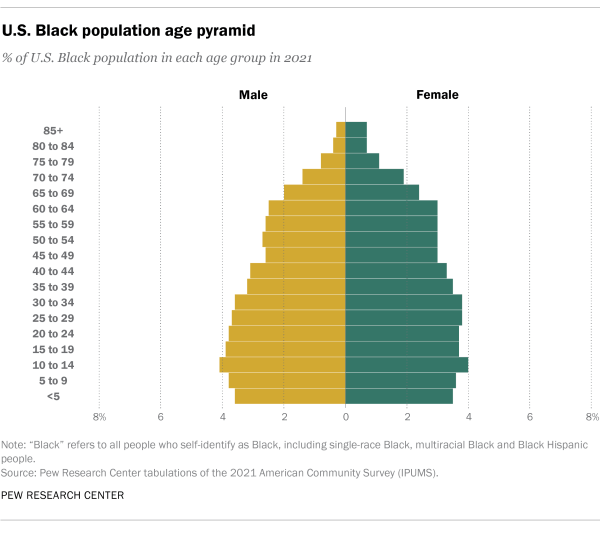
Just under half of the U.S. Black population (45%) was younger than 30 in 2021. A similar share (43%) was between 30 and 64 years old.
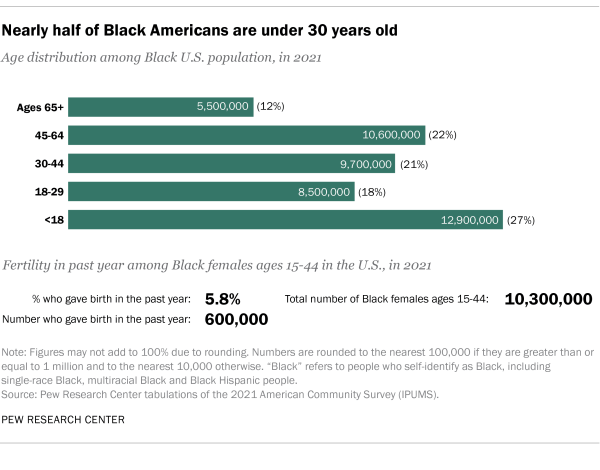
Fertility in the past year
The general fertility rate among Black females ages 15 to 44 was 5.8% in 2021, meaning that 5.8% of females in this age group had a birth in the previous 12 months.
2. Single race, non-Hispanic
The single-race, non-Hispanic Black population is also young. The median age of single-race Black people in 2021 was 35, three years younger than the full U.S. population’s median age of 38. Roughly 27% of the single-race Black population was below the age of 20, and 13% were 65 or older.
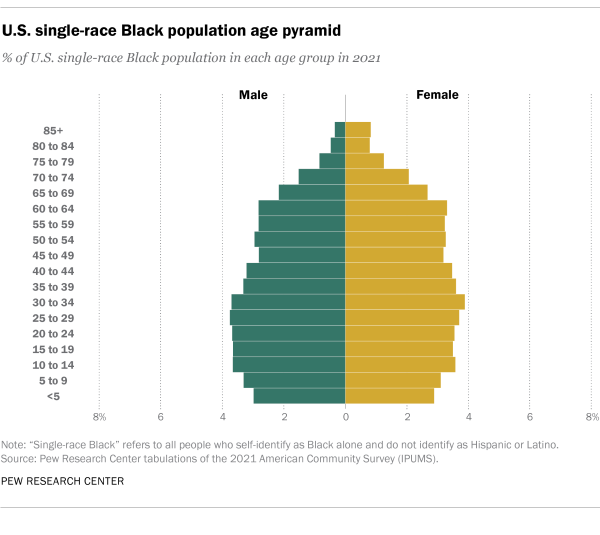
Roughly two in five (41%) members of the single-race Black population in the U.S. were under 30 in 2021. An additional 46% were aged 30 to 64.
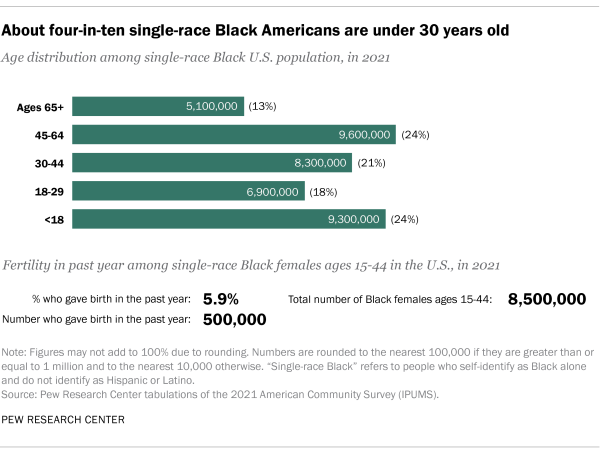
Fertility in the past year
The general fertility rate among single-race Black females ages 15 to 44 in the U.S. was 5.9% in 2021, meaning that 5.9% of females in this age group had a birth in the previous 12 months.
3. Multiracial, non-Hispanic
The multiracial, non-Hispanic Black population pyramid shows that this population is particularly young. The median age of multiracial Black people in 2021 was 20, making this the youngest subgroup of the Black population and significantly younger than the U.S. population overall (which had a median age of 38). Half of the multiracial Black population was below the age of 20 in 2021, and only 5% were age 65 or older.
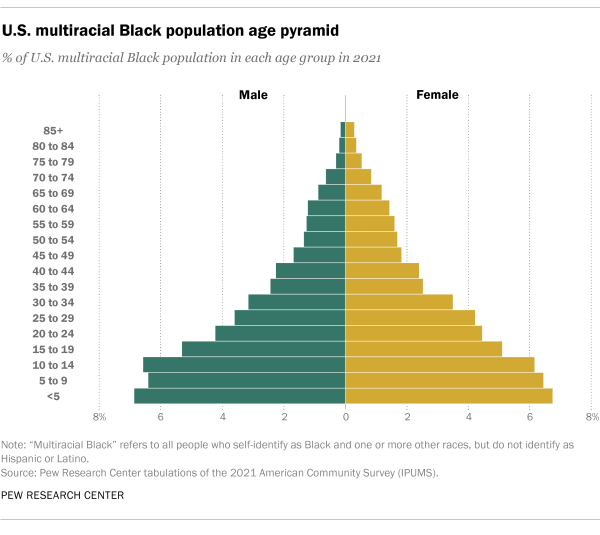
In 2021, two-thirds (66%) of multiracial Black people in the U.S. were under 30, while about three in ten (28%) were aged 30 to 64.
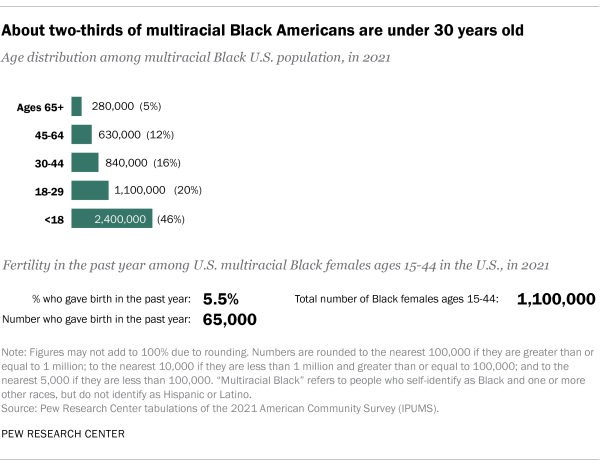
Fertility in the past year
The general fertility rate among multiracial Black females ages 15 to 44 in the U.S. was 5.5% in 2021, meaning that 5.5% of females in this age group had a birth in the previous 12 months.
4. Black Hispanic
The total Black Hispanic population is also quite young. The median age of this population group in 2021 was 22 years, making Black Hispanics the second-youngest group included in this analysis, and notably younger than the U.S. population, which had a median age of 38 years.
Just under half (47%) of the Black Hispanic population was below the age of 20, and 6% were 65 or older.
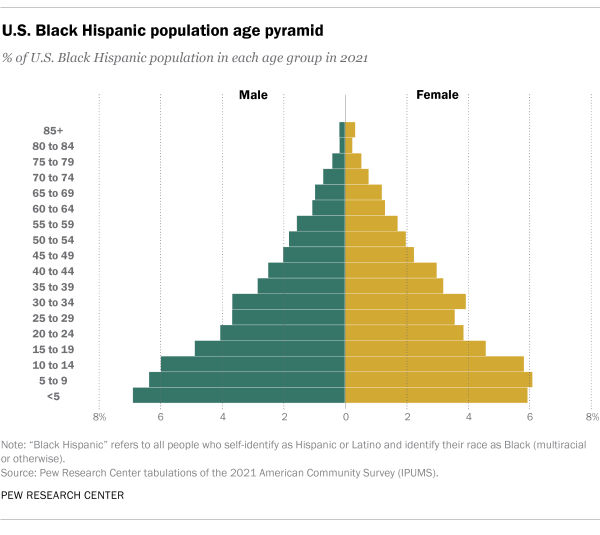
In 2021, 62% of the Black Hispanic population in the U.S. were under the age of 30. An additional 33% were ages 30 to 64.
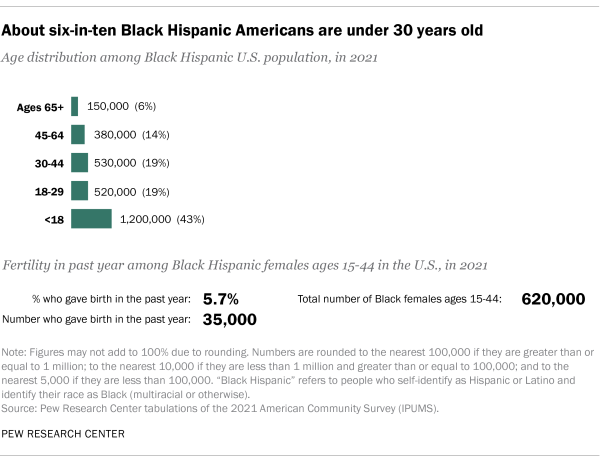
Fertility in the past year
The general fertility rate among Black Hispanic females ages 15 to 44 in the U.S. was 5.7% in 2021, meaning that 5.7% of females in this age group had a birth in the previous 12 months.
Languages
1. All Black
The vast majority (97%) of the Black population as of 2021 speaks either only English (89%) or if they speak another language, say they also speak English very well (8%). Besides English, other languages spoken at home by the U.S. Black population ages 5 and older include Spanish (3%), French or Haitian Creole (3%) and Amharic and other Ethiopian languages (1%).[1. “French or Haitian Creole” combines those whose language was recorded by the American Community Survey as either “French” or “French or Haitian Creole.”]
2. Single race, non-Hispanic
The vast majority (97%) of the single-race Black population in 2021 speaks either only English (91%) or if they speak another language at home, say they also speak English very well (6%). Besides English, other languages spoken by this part of the population ages 5 and older include French or Haitian Creole (3%), Spanish (1%) and Amharic and other Ethiopian languages (1%).[2. “French or Haitian Creole” combines those whose language was recorded by the American Community Survey as either “French” or “French or Haitian Creole.”]
3. Multiracial, non-Hispanic
The vast majority (98%) of the multiracial Black population in 2021 speaks either only English (92%) or if they speak another language at home, say also they speak English very well (6%). French or Haitian Creole is spoken by 2% of the multiracial Black population that is over age 5, as is Spanish.[3. “French or Haitian Creole” combines those whose language was recorded by the American Community Survey as either “French” or “French or Haitian Creole.”] Meanwhile, 1% of the population speaks Portuguese.
4. Black Hispanic
A substantial majority (84%) of the Hispanic Black population in 2021 speaks either only English (53%) or if they speak another language at home, say they also speak English very well (31%). Besides English, just under half (46%) of this population ages 5 and older speaks Spanish.
Geography
1. All Black
Regionally, the highest concentration of Black people in the U.S. in 2021 is in the South; more than half (56%) live there. Following the South, 17% live in the Midwest and the Northeast and 10% live in the West.
When it comes to states of residence, Texas is home to the largest Black population, at about 4.0 million. Florida comes in a close second with 3.8 million, and Georgia comes in third, with 3.6 million.
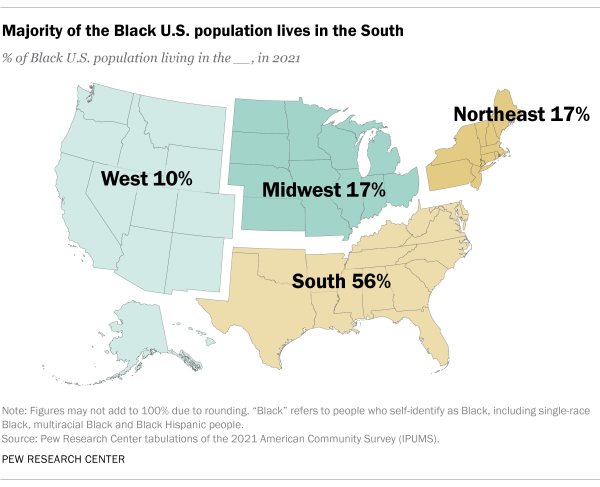
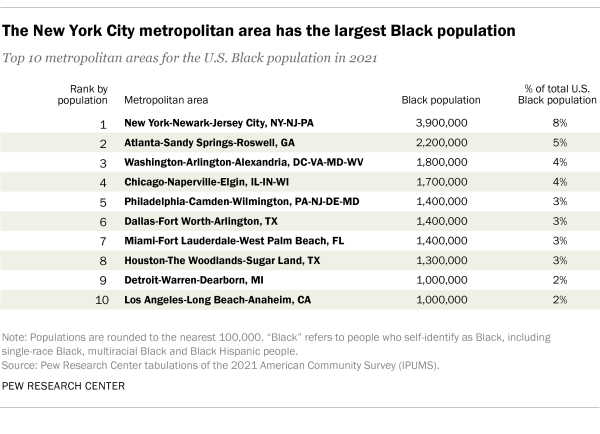
Among metropolitan areas, the New York City metro area – which includes parts of New Jersey and Pennsylvania – has the greatest number of Black residents (3.9 million). In a distant second is the Atlanta metro area, with 2.2 million, and then the Washington, D.C., metro area, with 1.8 million Black residents.
2. Single race, non-Hispanic
The South is also the region with the highest concentration of the single-race U.S. Black population: 59% of that group lives there as of 2021. The Midwest is home to 17%, while another 15% live in the Northeast and 9% live in the West.
The state of Texas has the largest number of single-race Black people (around 3.4 million), followed by Georgia (roughly 3.3 million) and Florida (about 3.2 million).
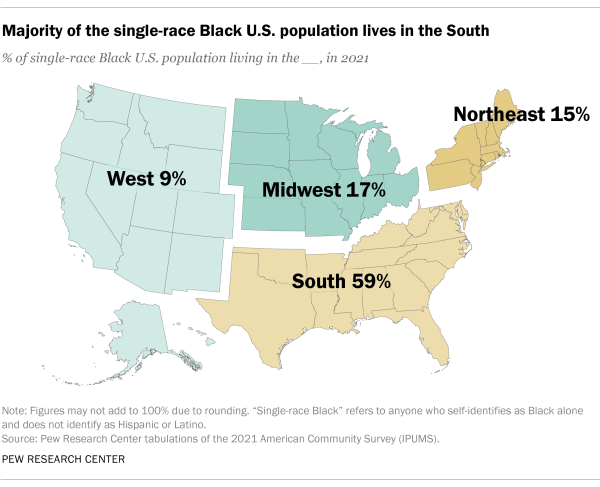
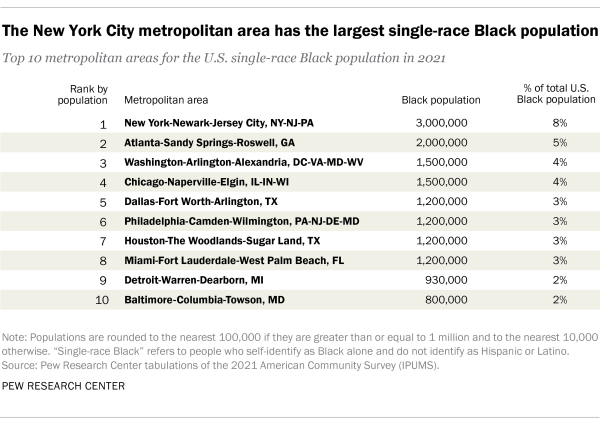
Among metropolitan areas, the New York City metro area – which includes parts of New Jersey and Pennsylvania – has the nation’s largest single-race Black population, with roughly 3.0 million. Other top metropolitan areas include Atlanta, Washington, D.C., Chicago and Philadelphia.
3. Multiracial, non-Hispanic
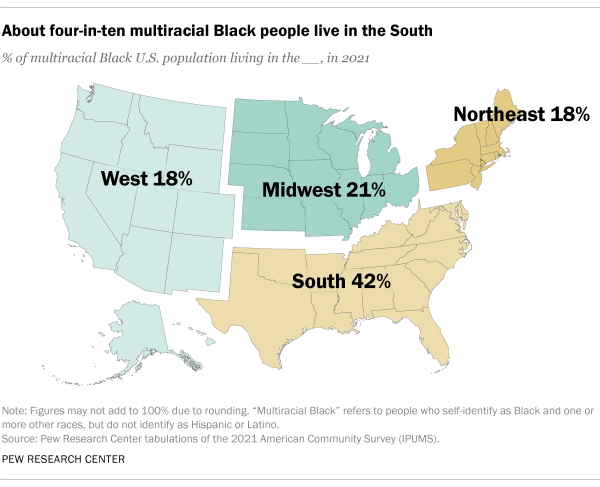
Regionally, the South is home to the highest concentration of the multiracial Black population in the U.S., with a plurality (42%) of the total as of 2021. Roughly one-fifth of each live in the Midwest (21%), the Northeast (18%) and the West (18%).
California is the top state of residence for multiracial Black people, with about 460,000 living there. Florida is home to 370,000 multiracial Black people, while Texas has 350,000.
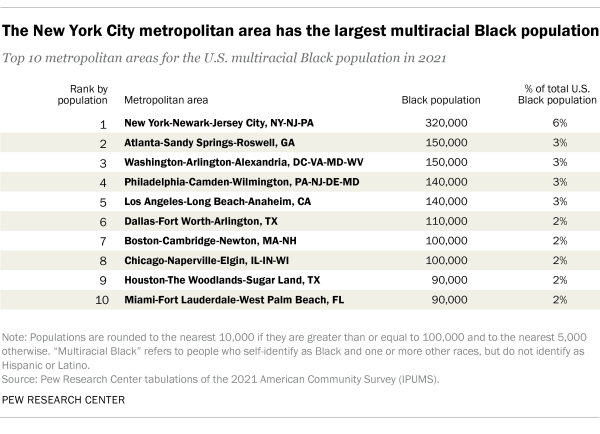
Among metropolitan areas, the New York City metro area – which includes parts of New Jersey and Pennsylvania – has the highest number of multiracial Black residents (320,000). Other top metropolitan areas for this subgroup include Atlanta, Washington, D.C., and Philadelphia.
4. Black Hispanic
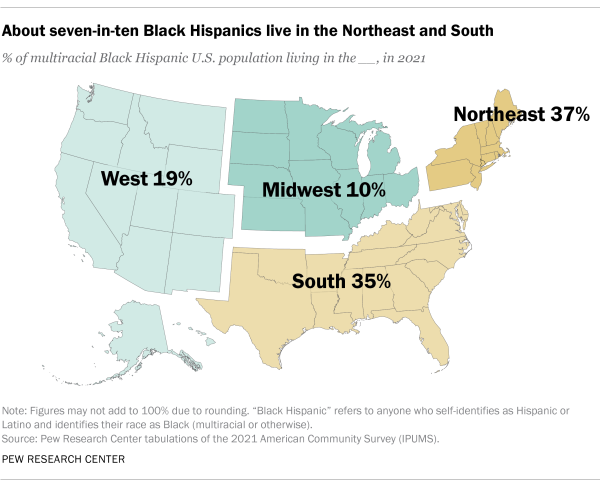
Regionally, Black Hispanic people are largely concentrated in the Northeast and South (71% in total). About one in five live in the West (19%), and one in ten live in the Midwest (10%) as of 2021. New York is the top state of residence for the Black Hispanic population, with 500,000 people living there. California is home to the second-highest number of this population (310,000), and Florida comes in third with 300,000 people.
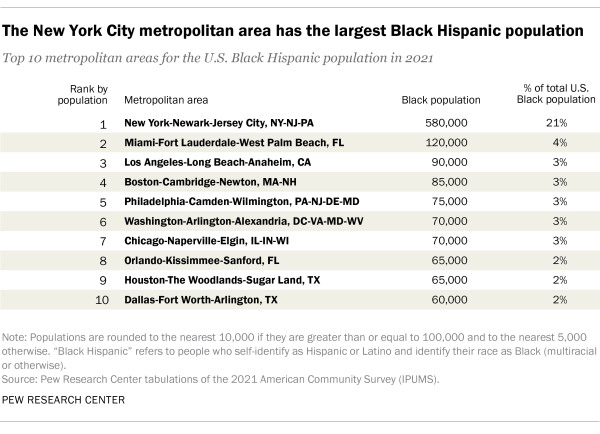
Among metropolitan areas, the New York City metro area – which includes parts of New Jersey and Pennsylvania – has the largest Black Hispanic population (580,000 people). Other top metropolitan areas for this subgroup include Miami, Los Angeles and Boston.
Household Income
1. All Black
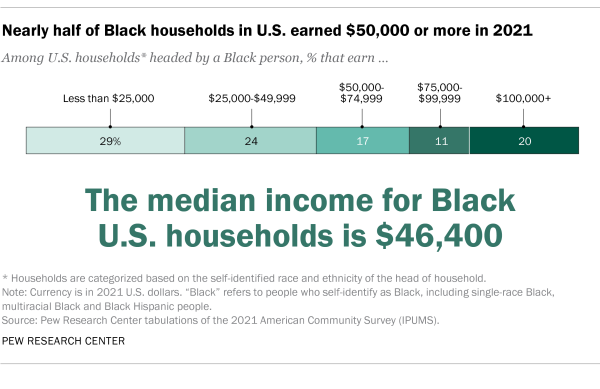
The median household income for Black U.S. households in 2021 is $46,400, which means half of households headed by a Black person earn more than that and half earn less.
Broader analysis shows that 52% of Black U.S. households earn less than $50,000, while 48% make $50,000 or more. Three in ten Black households (31%) make $75,000 or more, including 20% that make $100,000 or more.
2. Single race, non-Hispanic
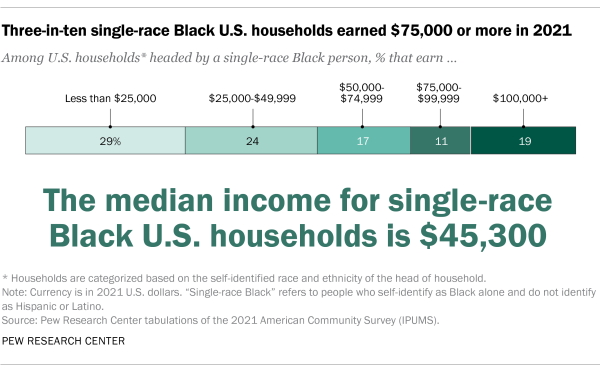
The median household income for single-race, non-Hispanic Black U.S. households in 2021 is $45,300, meaning half of households headed by a single-race Black person earn more than that and half earn less than that.
More than half of these households (53%) earn less than $50,000, with the other 47% making $50,000 or more. Three in ten make $75,000 or more, including about a fifth (19%) that make $100,000 or more.
3. Multiracial, non-Hispanic
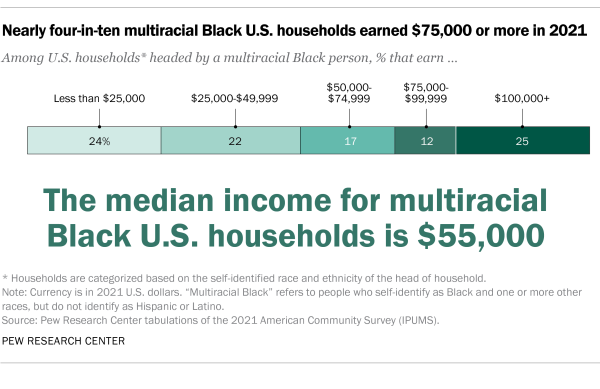
The median household income for multiracial, non-Hispanic Black U.S. households is $55,000, meaning half of households headed by a multiracial Black person earn more than that and half earn less than that sum as of 2021.
Looking at income another way, almost half of households with a multiracial Black householder (46%) make less than $50,000, and 54% make that sum or more. Over a third (37%) make $75,000 or more, including a quarter that make $100,000 or more.
4. Black Hispanic
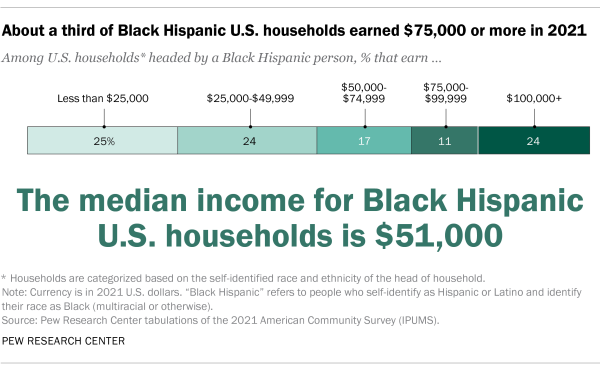
The median household income for Black Hispanic U.S. households is $51,000, meaning half of households with a Black Hispanic household head earn more than that and half earn less in 2021.
Further analysis shows about half (48%) of Black Hispanic households earn less than $50,000, while 52% make over $50,000. Roughly one in three of these households (35%) earn $75,000 or more, including about a quarter (24%) that make $100,000 or more.
Household Type
1. All Black
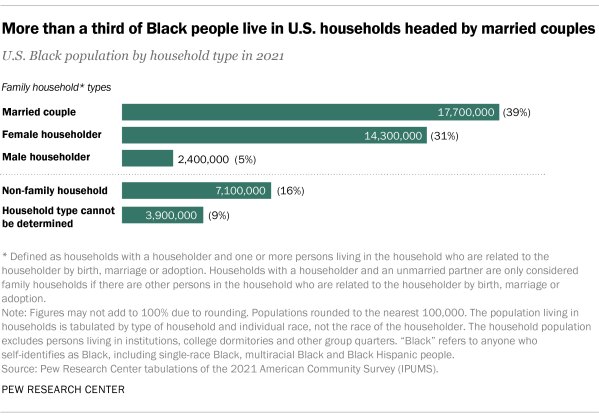
About four in ten Black people (39%) live in U.S. households that are headed by married couples as of 2021. Roughly three in ten Black people (31%) live in households whose household head is female, and 5% live in male-headed households. Fewer than two in ten (16%) are part of non-family households.
2. Single race, non-Hispanic
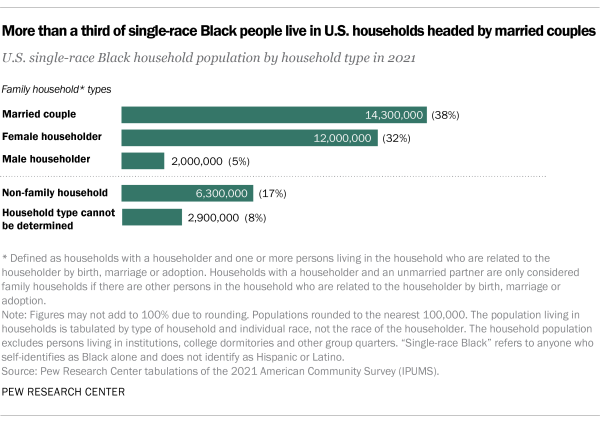
More than a third (38%) of single-race Black people live in U.S. households that are headed by married couples as of 2021. Roughly three in ten single-race Black people (32%) live in households with female household heads, and 5% live in male-headed households. Fewer than a two in ten (17%) live in non-family households.
3. Multiracial, non-Hispanic
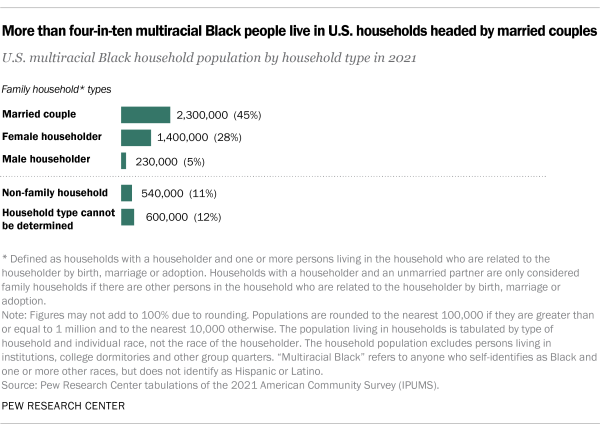
Just under half of multiracial Black people (45%) live in U.S. households that are headed by married couples as of 2021. About three in ten (28%) live in households whose head is female, and 5% live in male-headed households. Additionally, roughly one in five multiracial Black people (11%) live in non-family households.
4. Black Hispanic
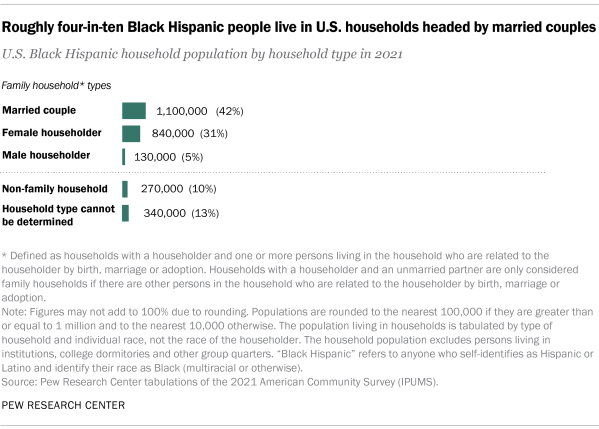
Roughly four in ten Black Hispanic people (42%) live in U.S. households headed by married couples in 2021. About three in ten Black Hispanic people (31%) lived in female-headed households and 5% lived in households headed by male householders. Roughly one in five (10%) Black Hispanic people lived in non-family households.
Educational Attainment
1. All Black
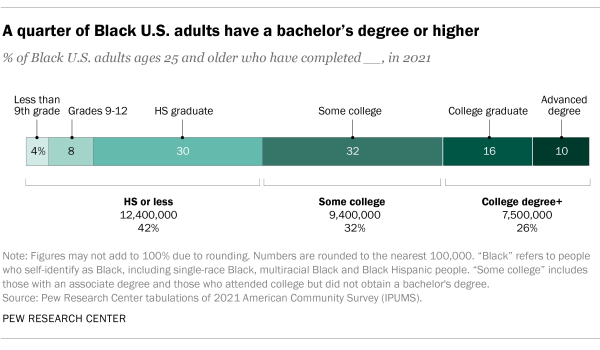
About a quarter (26%) of all Black U.S. adults ages 25 and older have a bachelor’s degree or more education. Another third (32%) have completed some college as of 2021, and roughly four in ten (42%) have, at most, graduated from high school (or earned an equivalent such as a GED certificate).
2. Single race, non-Hispanic
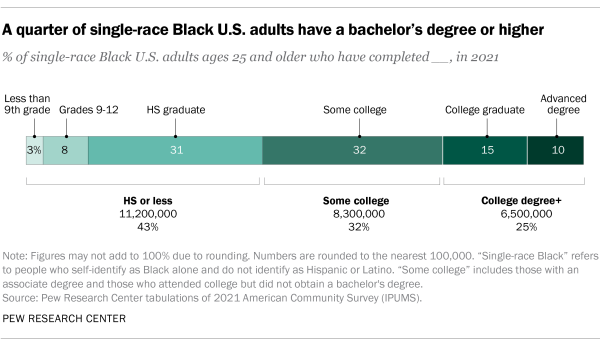
A quarter (25%) of single-race Black U.S. adults ages 25 and older have earned a bachelor’s degree or higher as of 2021. Another third (32%) have completed some college and 43% have, at most, graduated from high school or obtained an equivalent certificate.
3. Multiracial, non-Hispanic
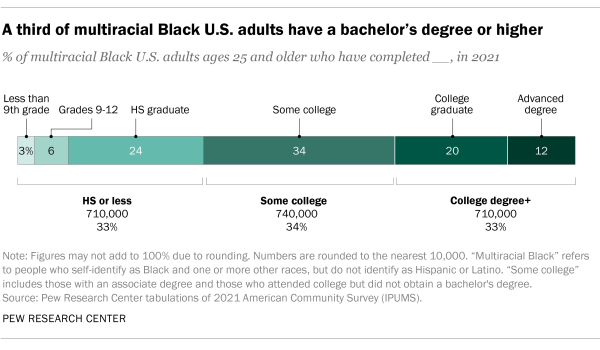
A third (33%) of multiracial Black U.S. adults ages 25 and older have earned a bachelor’s degree or higher as of 2021. Similar shares have completed some college (34%) or at most, graduated from high school or its equivalent (33%).
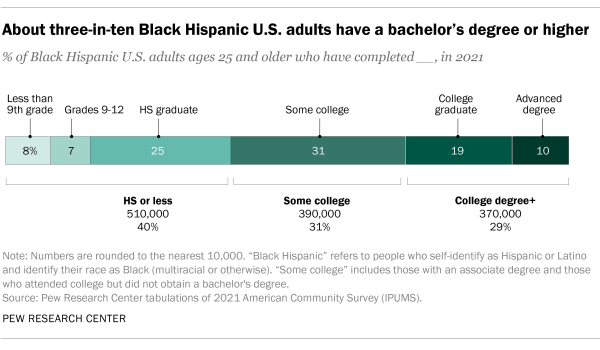
4. Black Hispanic
Almost three in ten Black Hispanic U.S. adults ages 25 and older (29%) have earned a bachelor’s degree or higher as of 2021. A similar share (31%) has completed some college, while four in ten have, at most, graduated from high school or its equivalent.
Religious Affiliation
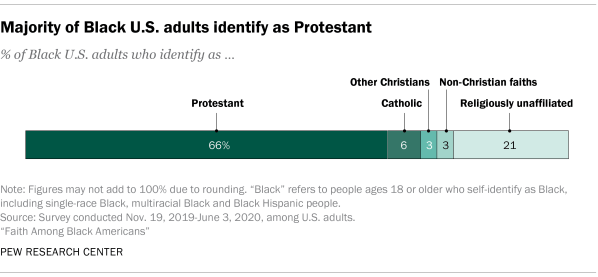
1. All Black
Two thirds (66%) of all Black adults identify as Protestant. Roughly one in five (21%) are religiously unaffiliated, while smaller shares of adults identify as Catholic (6%), or with other Christian denominations (3%) or non-Christian faiths (3%).
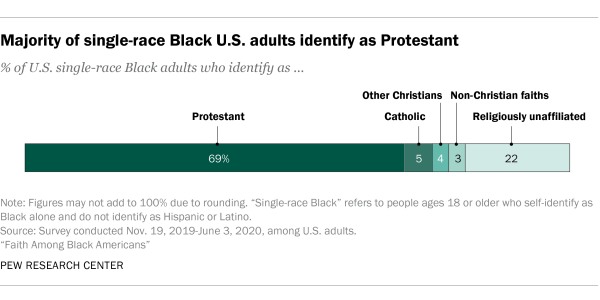
2. Single race, non-Hispanic
A majority (69%) of single-race Black adults identify as Protestant. Roughly one in five (19%) are religiously unaffiliated, while smaller shares of adults identify as Catholic (5%), or with other Christian denominations (3%) or non-Christian faiths (3%).
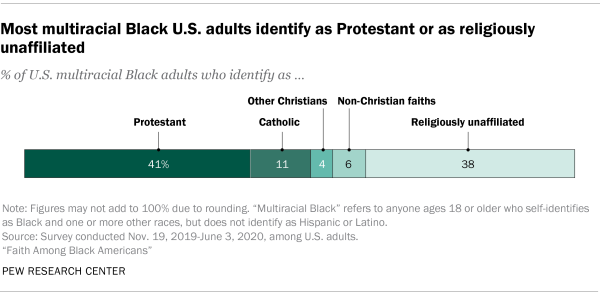
3. Multiracial, non-Hispanic
Similar shares of multiracial Black adults identify as Protestant (41%) or as religiously unaffiliated (38%). Smaller shares of adults within this population subgroup identify as Catholic (11%), or with other Christian denominations (4%) or non-Christian faiths (6%).
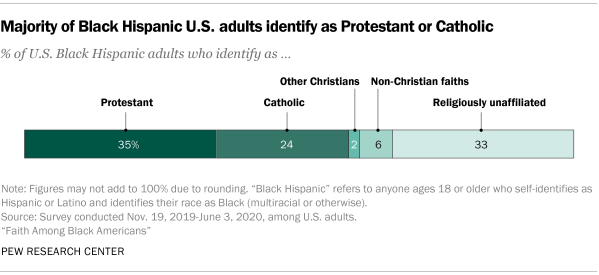
4. Black Hispanic
Almost six in ten Black Hispanic adults (59%) identify as either Protestant (35%) or Catholic (24%). A third identify as religiously unaffiliated (33%), while smaller shares identify with other Christian denominations (2%) or follow non-Christian faiths (6%).